
GRAB MY FREE TRAINING
The No Leaks Funnel

GRAB MY FREE APP
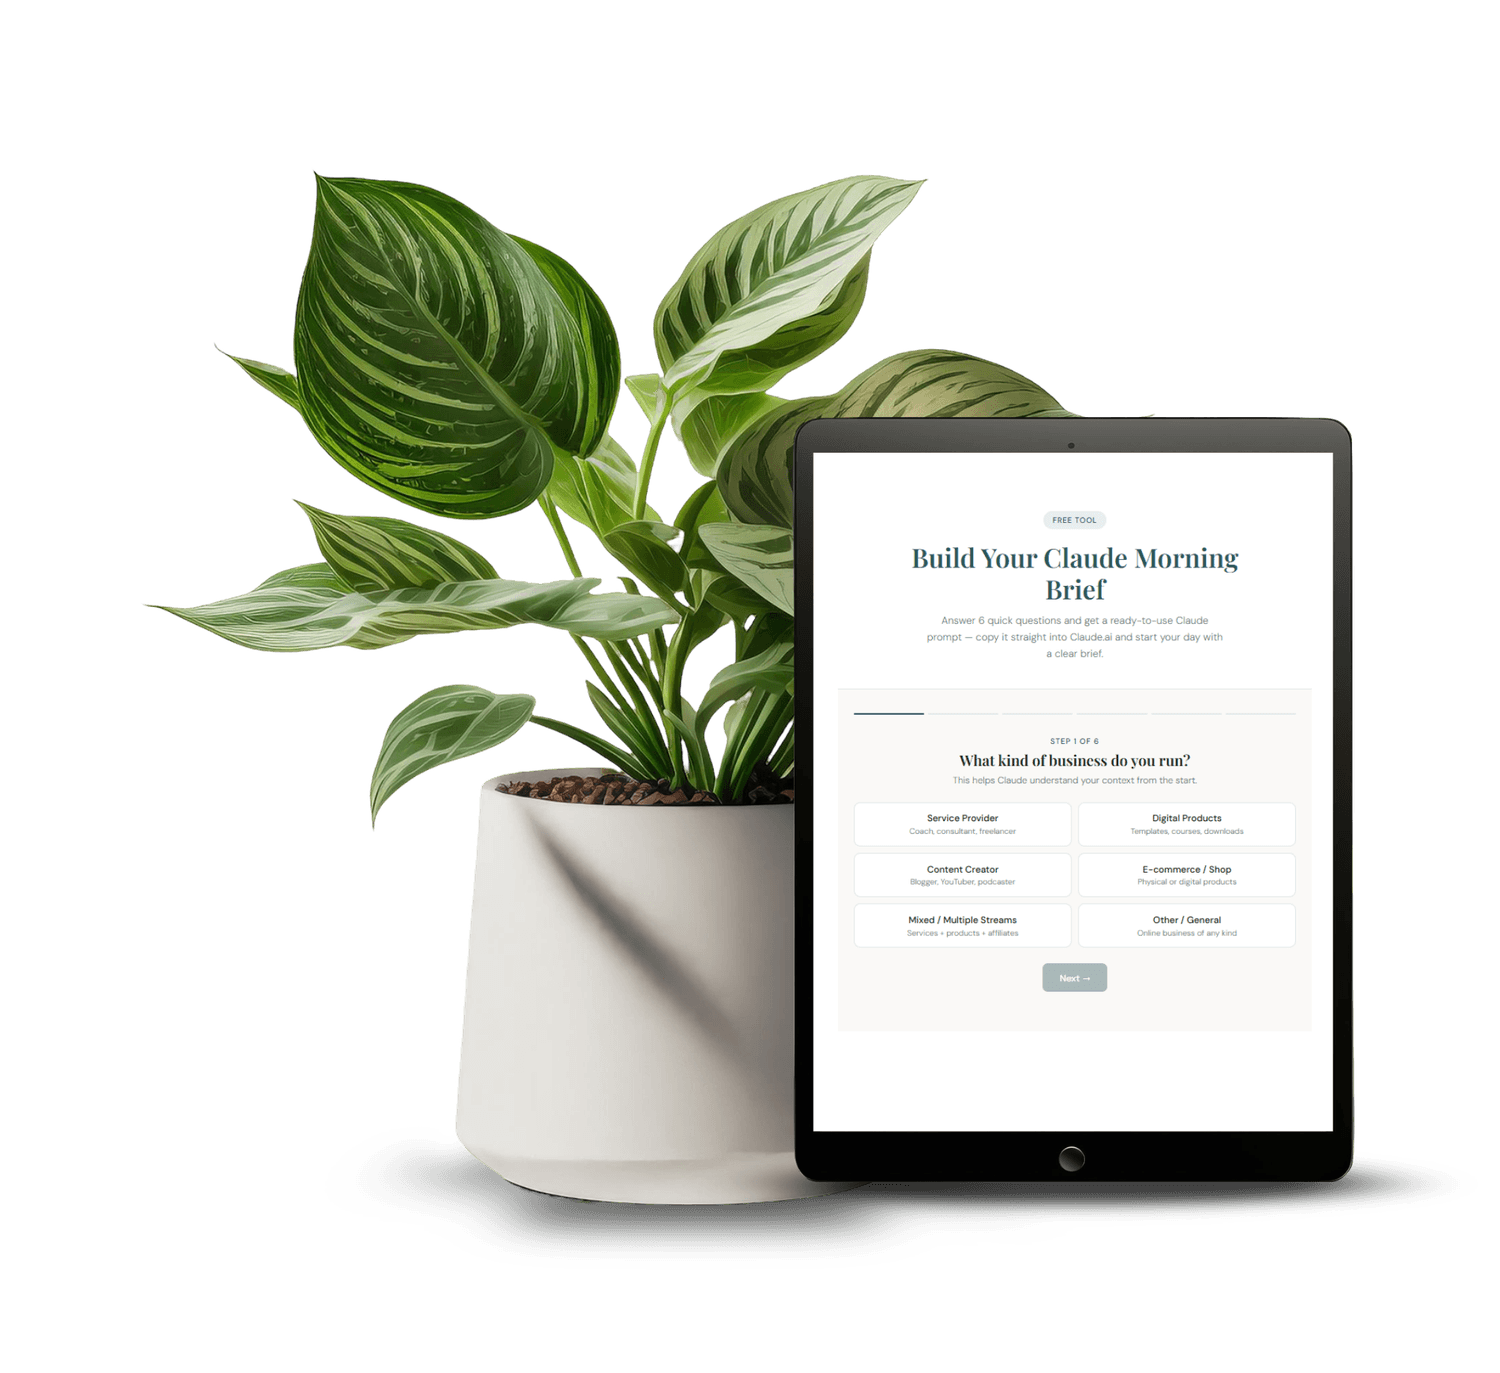
Morning Brief Claude AI Prompt
Set-up your custom morning brief for Claude
GRAB MY FREE APP
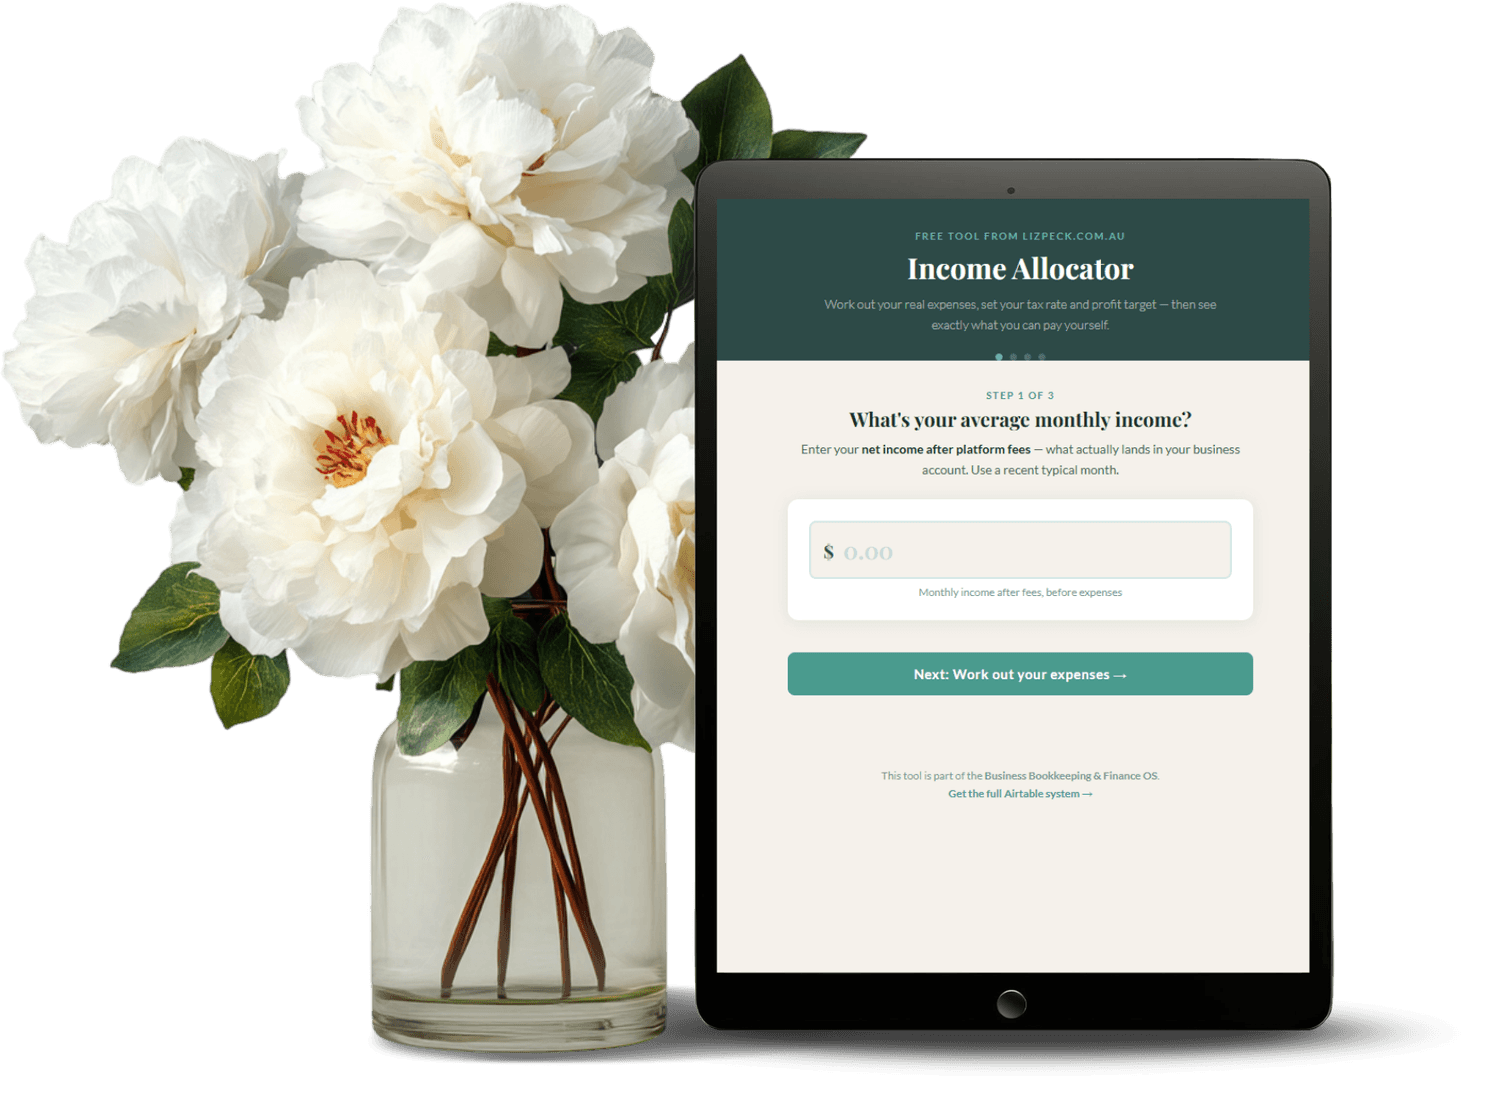
Income Allocator
Work out how to break down your income properly with percentages
How to Track Your Content Performance in Airtable (Know What's Working Before You Publish More)
If you're not tracking content performance, you're guessing about what to create next. You spend time on something you think is working, it gets no engagement, and you still publish similar content next week because you have no data saying otherwise. Most people don't realise they're recreating the same mistakes repeatedly.
What actually helped was setting up a simple metrics table where every week you can see exactly what got traction and what didn't. Not just engagement counts, but which topics people actually cared about, which platforms drove traffic, what formats worked. Once you have a system, you stop wasting energy on content nobody engages with.
Build a Weekly Metrics Table With All Your Platforms
Create one table in Airtable with a row for each piece of content you publish. Include the date published, the platform, the topic, the type of content (blog, email, reel, etc.), and a field for each metric that matters to you.
For blog posts, track page views and time on page. For social, track likes, comments, and shares. For email, track opens and clicks. Keep the same metrics consistent across weeks so you can actually compare performance over time.
Link Everything to Your Content Calendar
If you have a content calendar table, link your metrics back to it. This way you can see the original plan, the content that was published, and then the performance data all connected. You're not jumping between different systems trying to find the context.
The connection also makes it easy to see patterns. Maybe certain topics from your calendar consistently underperform. Maybe guest contributions outperform your own content. These patterns only show up when everything is linked properly.
Set Up a Weekly Automation to Pull Your Stats
Instead of manually collecting metrics every week, use Make or Claude to pull the data for you. Run an automation that grabs your page views from Google Analytics, your social metrics from each platform, your email stats from your platform. Everything gets returned to one table.
This takes the manual work out and means you're less likely to skip it. When something's automatic, it actually happens every single week instead of sporadically.
Create a Simple Dashboard to See It All at Once
Your metrics table is useful, but a dashboard view is where insights actually happen. Create a summary view that shows total views this week, average engagement per post, top performing topic, top performing platform, and engagement trend from last week.
You need to see the big picture in thirty seconds. Dashboards let you do that. You glance at it during your weekly review and immediately know what's working.
Notice Patterns, Don't Just Look at Numbers
Data is only useful if you actually use it to make decisions. At the end of each week, spend fifteen minutes asking: What surprised me? What disappointed me? What should I do more of? What should I stop doing?
If every piece of content about systems gets 3x the engagement of your other content, that's a signal. Your audience is telling you what they want. If email gets 15% open rate but Instagram reels get zero saves, you know where your effort is best spent.
Compare Month to Month to See Real Trends
One week of data is noise. One month of data is a pattern. Set a reminder at the end of each month to compare your stats to the previous month. Are your YouTube views trending up? Is your email open rate improving? Is blog traffic growing? Look for directional movement, not perfect numbers. If something is consistently declining, that's a signal to investigate. If something is consistently growing, that's a signal to do more of it. Your content strategy should be responsive to the data you're collecting.
Use Claude to Help You Interpret the Data
You don't need to interpret raw data alone. Once a week, copy your stats from your Airtable dashboard and paste them into Claude with a simple prompt: 'Here are my content stats for the week. What patterns do you notice? What would you recommend I focus on next week?' Claude can spot correlations you might miss, flag anomalies, and suggest experiments to run. It turns raw numbers into actual decisions, which is the whole point of tracking.
Use a Ready-Made System Instead of Building From Scratch
You don't need to build this from scratch. The Content System Starter already includes a content tracker, a metrics table, and a weekly review dashboard — all pre-built and ready to use. You connect it to your platforms, fill in your stats each week, and the views and formulas do the heavy lifting. It's designed for solo business owners who want the data without the setup time. If you're running on Airtable, this system plugs straight in.
Let Your Data Inform Your Content Strategy for Next Month
At the end of each month, review your whole system. Look at your top five pieces of content. What topics came up most often? What formats performed best? What calls to action converted? Use those answers to inform your content plan for the following month. This doesn't mean you only create what works — you still experiment. But it means you're not guessing. You're iterating. That's the difference between a business that grows and one that just stays busy.
FAQ
What metrics should I track for my content?
Track views, engagement (likes, comments, saves), click-through rate, and conversions. For blog posts, track page views, time on page, and search rankings. For email, track open rate and click rate. Start with the platforms you're already using and add more as your system matures.
How often should I update my content metrics in Airtable?
Once a week is ideal. Set aside fifteen minutes every Monday or Friday to pull your stats and fill in your Airtable metrics table. Consistency matters more than frequency — weekly data over three months gives you far more insight than daily data over two weeks.
Do I need to connect Airtable to my analytics platforms?
You can, but you don't have to. Many business owners manually enter stats from each platform into Airtable once a week. If you want to automate it, tools like Make can pull data from Google Analytics, YouTube, and other platforms into Airtable automatically.
What if my numbers are low — should I still track them?
Absolutely. Low numbers are data too. They show you what's not working, which is just as valuable as knowing what is. Track everything from the start so you have a baseline to measure growth against. Everyone starts somewhere.
Can I use this system if I'm only on one or two platforms?
Yes — in fact, that's the best place to start. Pick the one or two platforms you're most active on and track those consistently. Once you've built the habit, you can add more platforms. A simple system you actually use beats a complex one you abandon.
Disclaimer:
This website may contain affiliate links. If you click a link and make a purchase, I may receive a small commission at no extra cost to you.

About Liz Peck
Liz Peck helps online business owners build the backend that runs without them - using Airtable for operations, Systeme for sales, and Claude AI for the work you hate doing twice. lizpeck.com.au

Disclaimer:
This website may contain affiliate links. If you click a link and make a purchase, I may receive a small commission at no extra cost to you.